Note
Click here to download the full example code
This is my example script
This example doesn’t do much, it just makes a simple plot
This is a section header
This is the first section! The #%% signifies to Sphinx-Gallery that this text should be rendered as rST and if using one of the above IDE/plugin’s, also signifies the start of a ‘code block’.
import spatial_ops

# This line won't be rendered as rST because there's a space after the last block.
myvariable = 2
print("my variable is {}".format(myvariable))
# This is the end of the 'code block' (if using an above IDE). All code within
# this block can be easily executed all at once.
Out:
my variable is 2
This is another section header
In the built documentation, it will be rendered as rST after the code above! This is also another code block.
print('my variable plus 2 is {}'.format(myvariable + 2))
Out:
my variable plus 2 is 4
This is another section header
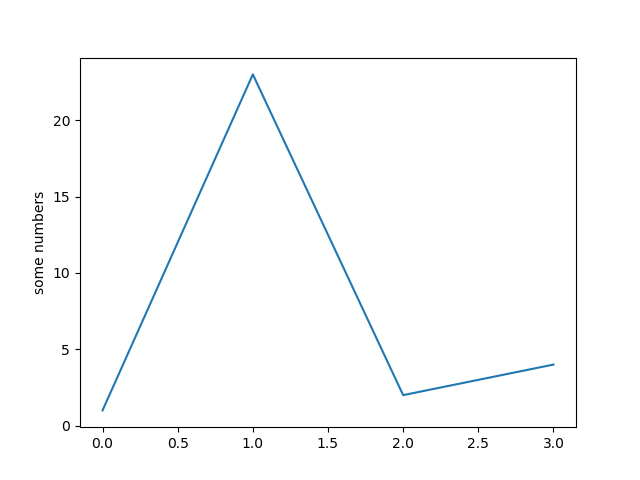
Plots look nice in examples
import matplotlib.pyplot as plt

plt.plot([1,23,2,4])
plt.ylabel('some numbers')

plt.show()
Total running time of the script: ( 0 minutes 0.201 seconds)